
Why I made Gantt chart for the project?

As long as many people involved, we have to set a timeline to put our energy and work efficiently and smartly. Having shared documents, we were easy to put everyone on the same page and track our works. Besides, we can manage our own time and finish our project successfully.
- Overview
- What was the problem
- How I solve it.
- What I’ve learned from it.
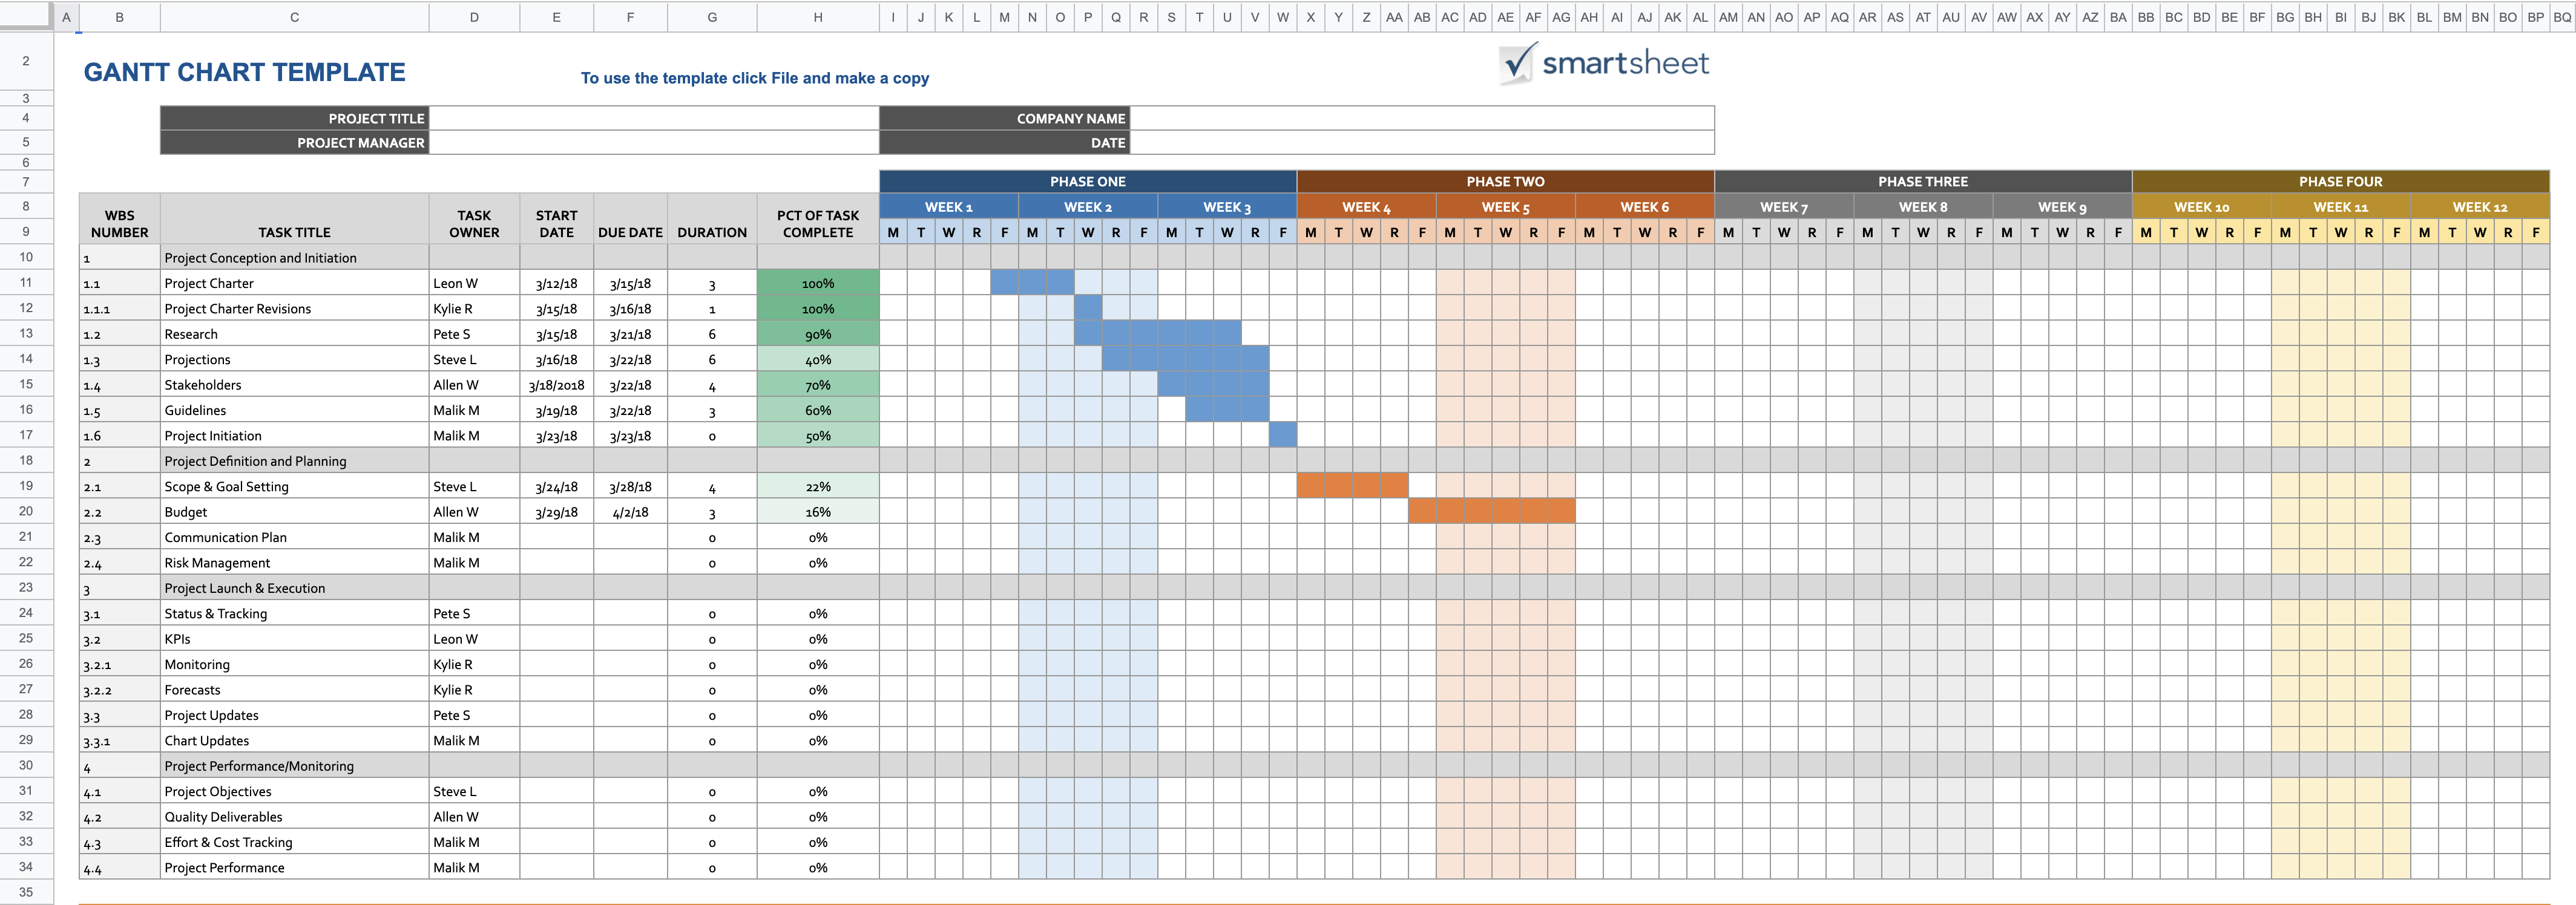
1. Overview
A Gantt chart is a tool for project management developed by Henry Gantt. It is a bar chart that shows the start and end times for each task in the project schedule. It usually breakdown the project into detailed main tasks and sub-tasks.
2. What was the problem
There are tones of programs that help project management, such as Airtable, Google calender, Trello, Jira, Monday.com, Asana, Evernote, Todoist, Slack, etc. I used these programs and chose templates that suit the best for the situations. However, this time, the clients asked me to share the project estimate time and schedule using excel. I didn’t know what type of chart is best for the projects and started to drill it down.
3. How I solve it
To estimate the time needed to accomplish the goal, I need to know what things should be done, which tasks should be assigned to a certain person, how long do they take and what kind of difficulties they might pace.
First, I had a phone interview with the client.
1) What do you expect to be handed in which format,
2) in order to fit the quality you want, is there any points you are especially focusing on,
3) are you providing copies,
4) Assets needed in this project ready,
5) Do you have special concepts in your mind,
6) Who will be the contact point,
7) what is your favorite communication methods, and
8) When are you expected to live the site?
Based on the answer I’ve got, I could make a chart. This is all in Korean but you will get the idea. 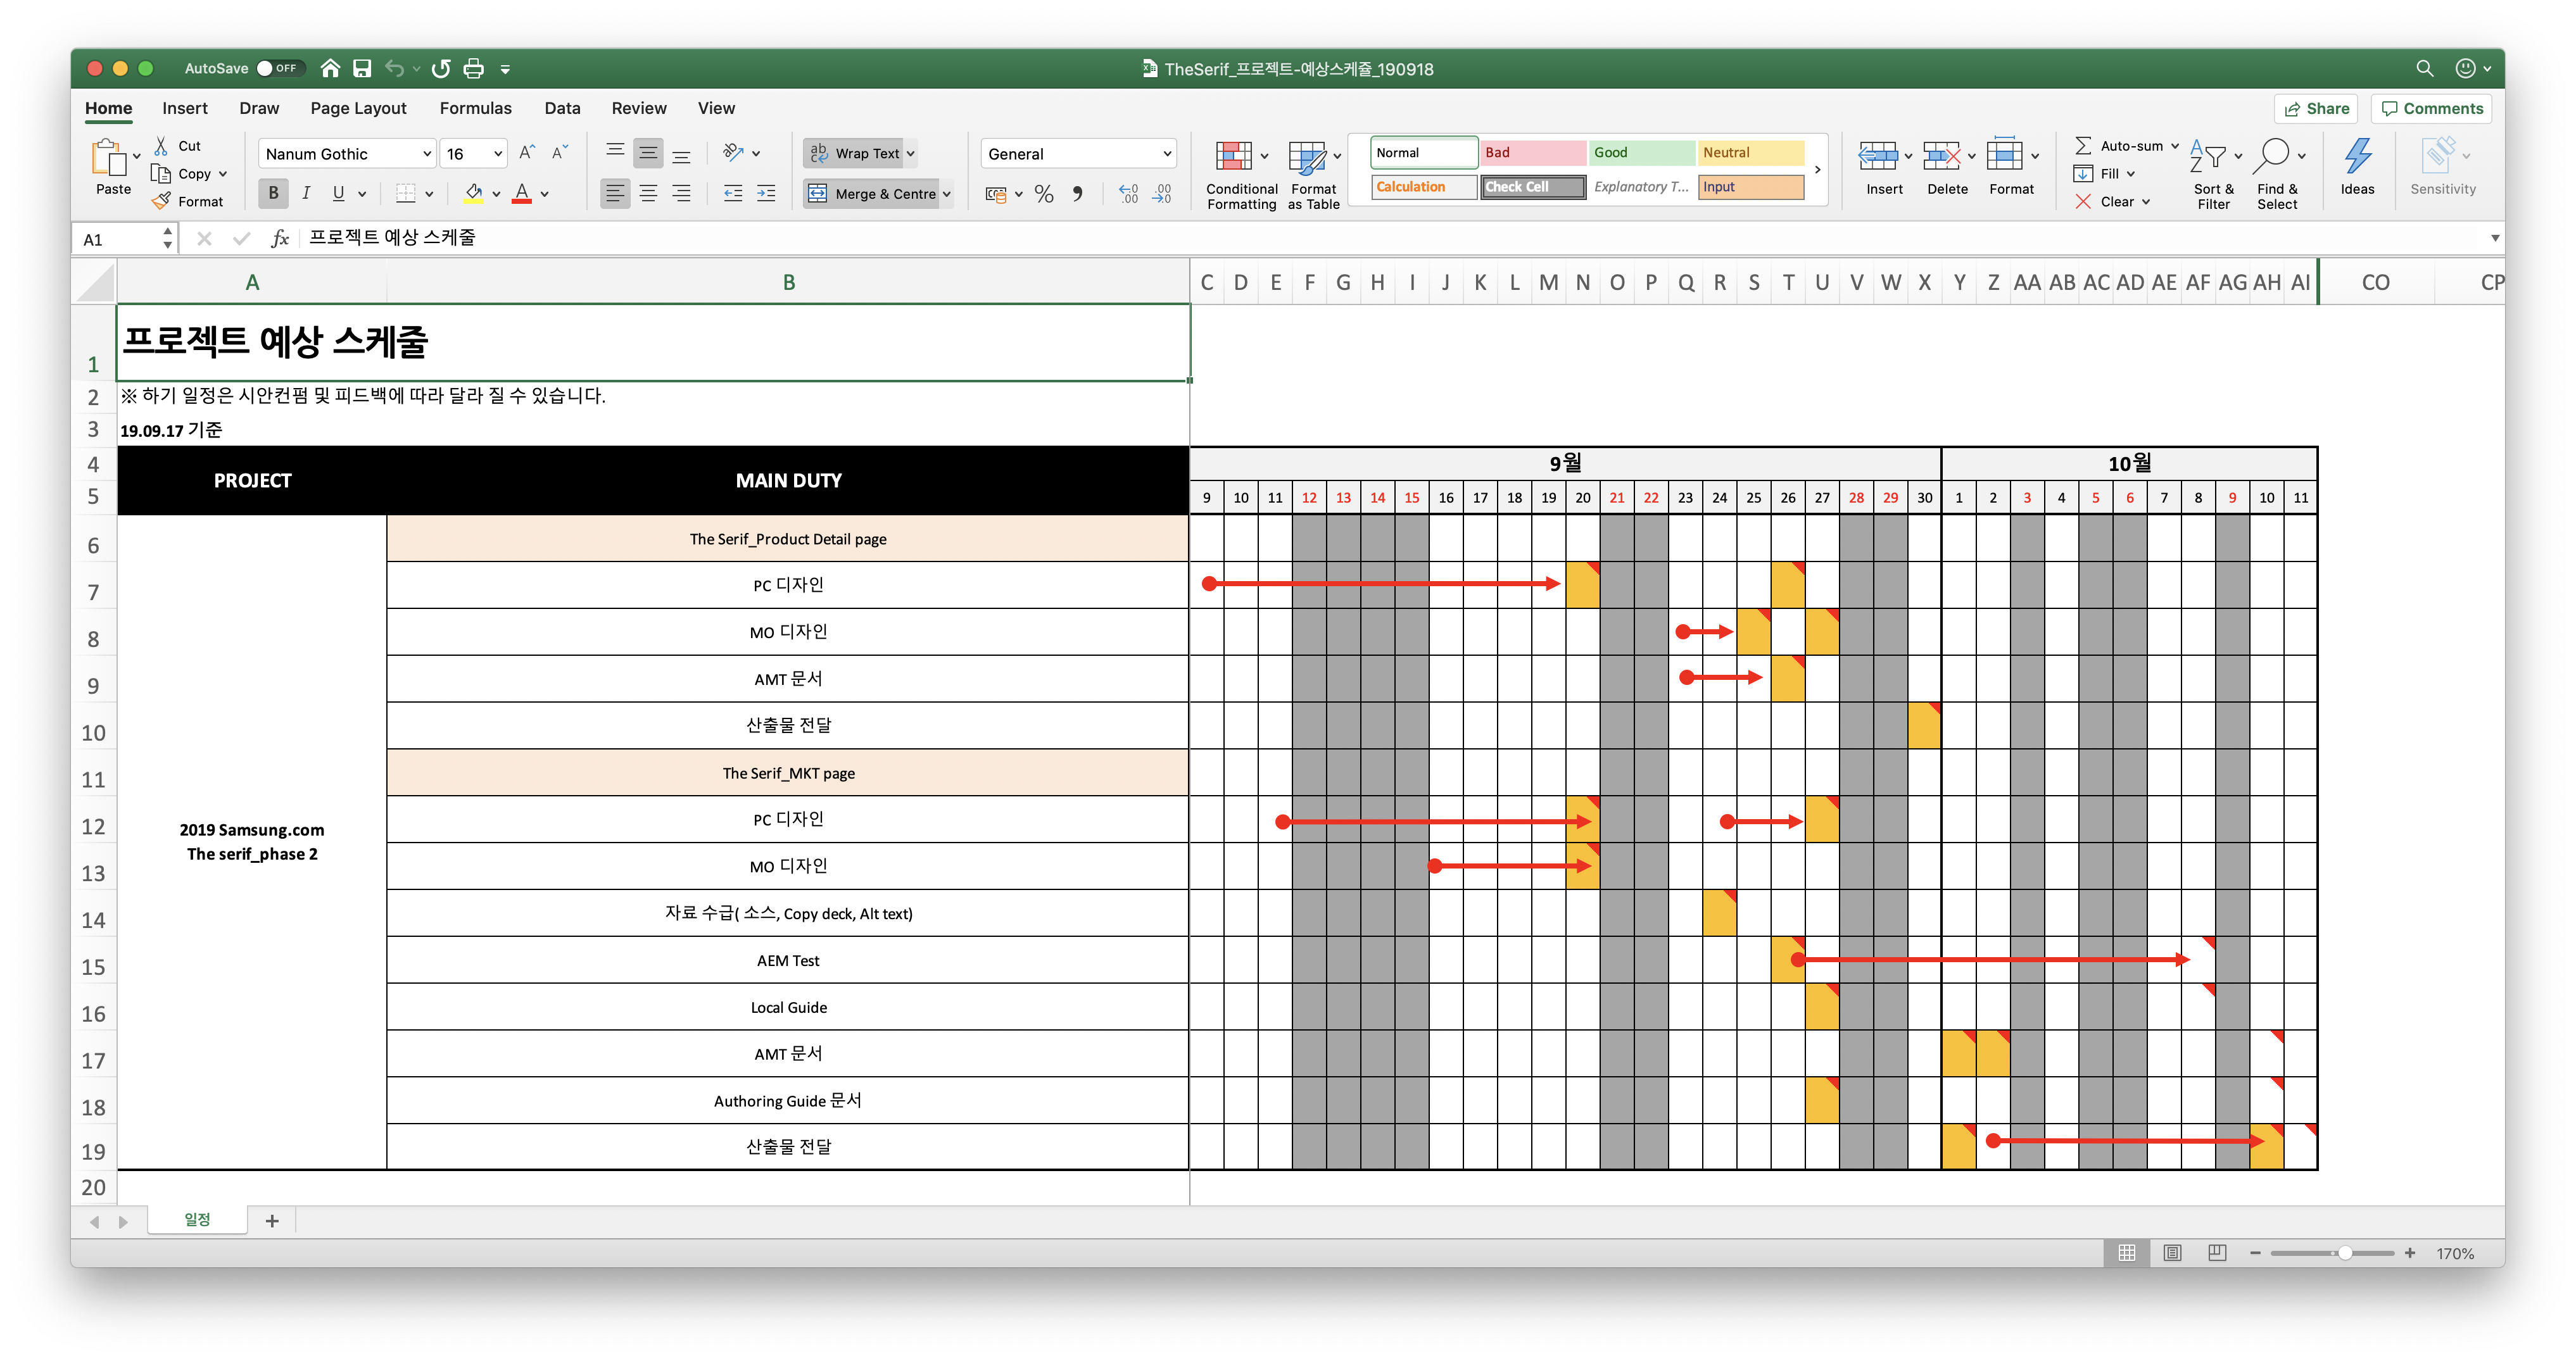
4. What I’ve learned from it
Making a chart is not a big deal. The real value of making this chart is for communication. To clarify and bring all the parties on the same page, I recommend having a session for this. It shouldn’t have to follow the format or documentation. With this, It was much easier to communicate and meet the satisfaction of both parties. We could finish the project two weeks earlier than it initially expected for one month.
I like the sense of we’re all on the same page and trying to get the job done. Pablo Bryson
Comments